
How and why to rebalance diversed portfolios
Market returns and cash flows cause portfolio asset class exposures to drift away from their targets over time. Rebalancing is needed to keep a portfolio aligned with its intended exposures, risk profile and benchmark. Written by Stephen Flegg
12 minutes
Market returns and cash flows cause portfolio asset class exposures to drift away from their targets over time. Rebalancing is needed to keep a portfolio aligned with its intended exposures, risk profile and benchmark.
Rebalancing solves two key problems
- Portfolio drift: Cash flows and differences in asset class returns can push a portfolio away from its intended risk profile. Over time, portfolios can become more growth or defensively oriented than intended. For example, market returns can turn a Balanced Fund into a Growth or even a High Growth fund.
- Benchmark tracking error: Multi-asset benchmarks embed assumptions about how and when portfolios are rebalanced. If a portfolio is not rebalanced consistently, it will experience undesired tracking error relative to its benchmark.
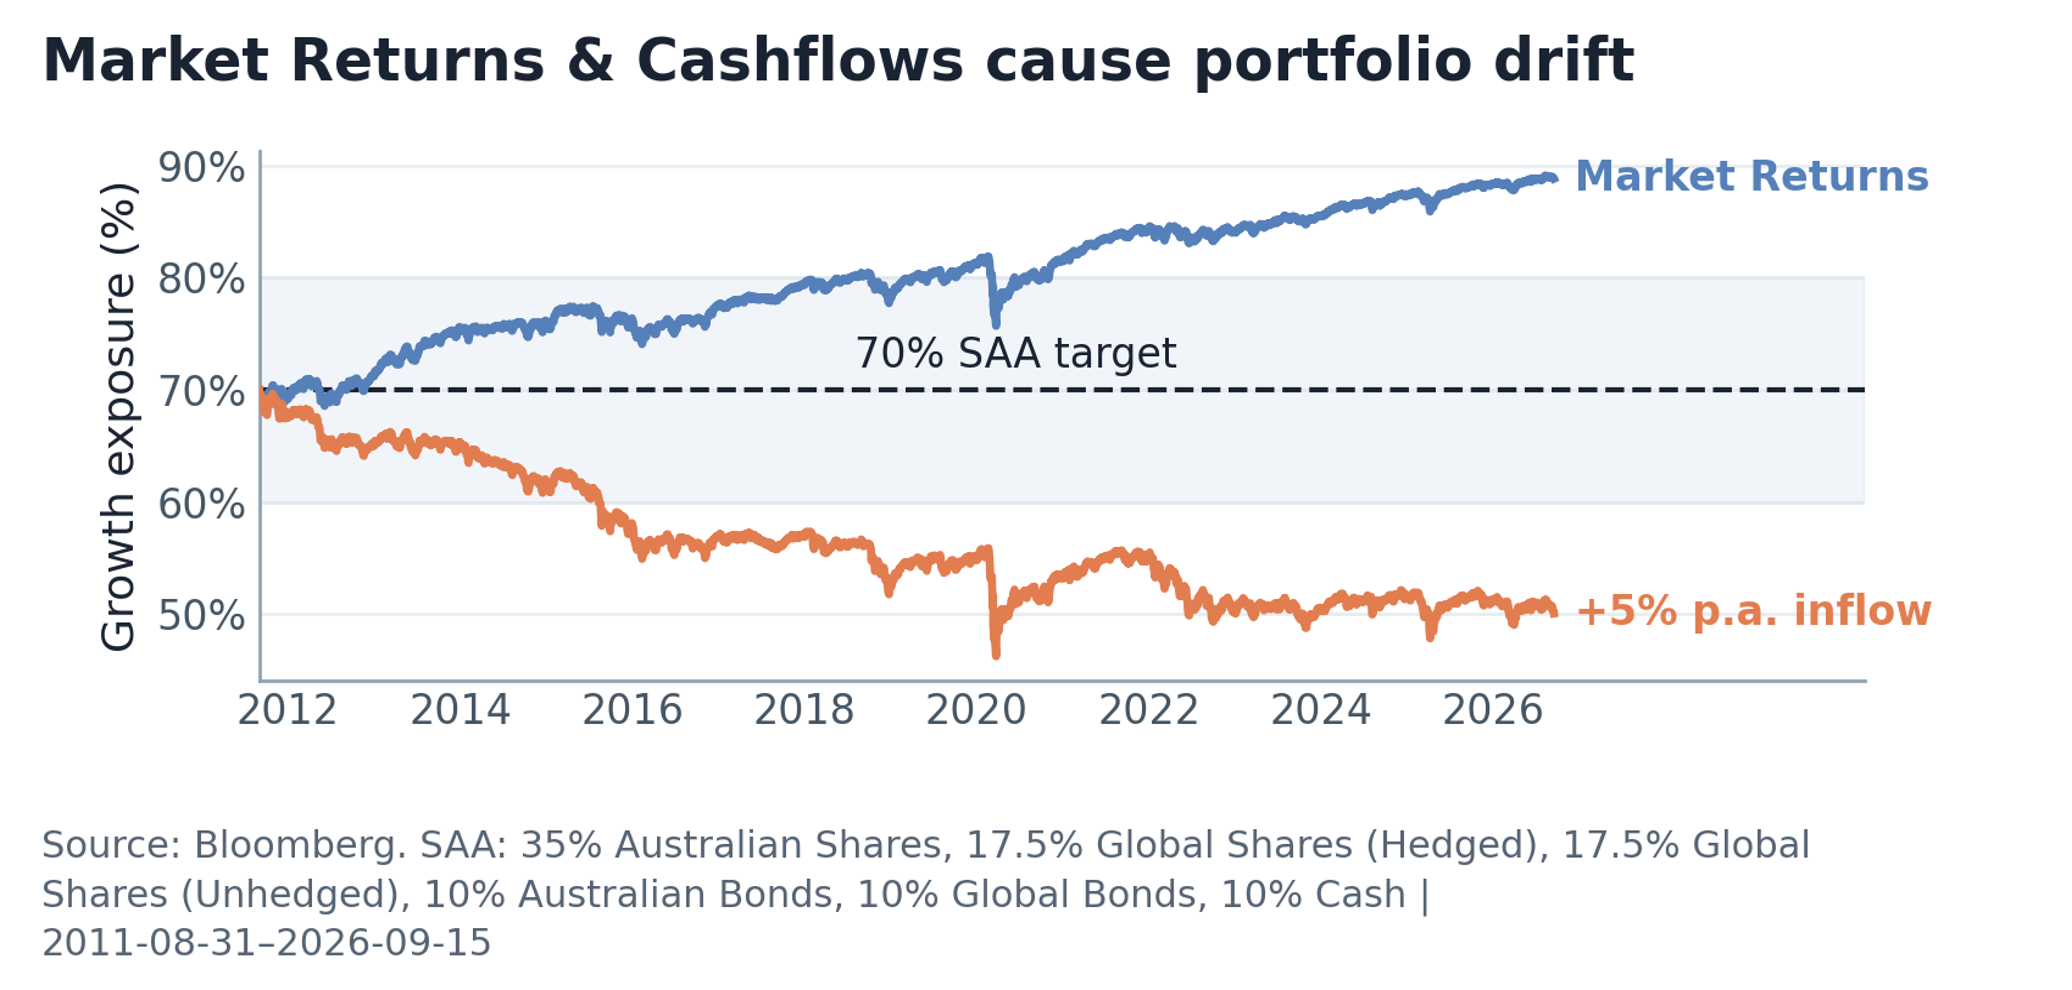
Chart explanation
The blue line (top) shows how positive equity returns can push a portfolio that is not rebalanced into a higher risk profile over time. The orange line (bottom) shows how even modest cash inflows of +5% p.a. can shift a Balanced portfolio down a full risk profile without rebalancing. Both simulations use actual historical returns and are shown for illustrative purposes.
Diversified vs single asset class rebalancing
Rebalancing in diversified portfolios is fundamentally different from rebalancing within a single asset class. Single asset class portfolios typically track benchmarks which have floating weights and primarily rebalance because securities enter or leave the investible universe. Diversified portfolios, by contrast, have fixed asset class weights and a stable investible universe.
Know what you are rebalancing to
Diversified funds typically have a strategic asset allocation (SAA) which specifies their target exposure to each asset class. This SAA serves as the fund's benchmark. But, like portfolios, SAA benchmarks also need to be rebalanced or they will drift away from their target over time. Diversified funds need to choose a rebalancing frequency for their SAA benchmark. Common approaches are daily (fixed weights), monthly and quarterly.
An effective portfolio rebalancing policy needs to account for the rebalancing methodology of the benchmark.
Beware of imaginary alpha
For Australian portfolios, benchmark rebalancing can also create ‘imaginary alpha’ in the benchmark returns. This occurs because Australian markets close before offshore markets, so when benchmark weights are reset, Australian assets are valued using stale, uninvestible prices. This can create a persistent upward bias in benchmark returns, making portfolio performance appear relatively weaker. The effect is most pronounced in daily rebalanced benchmarks, where weights are reset more frequently.
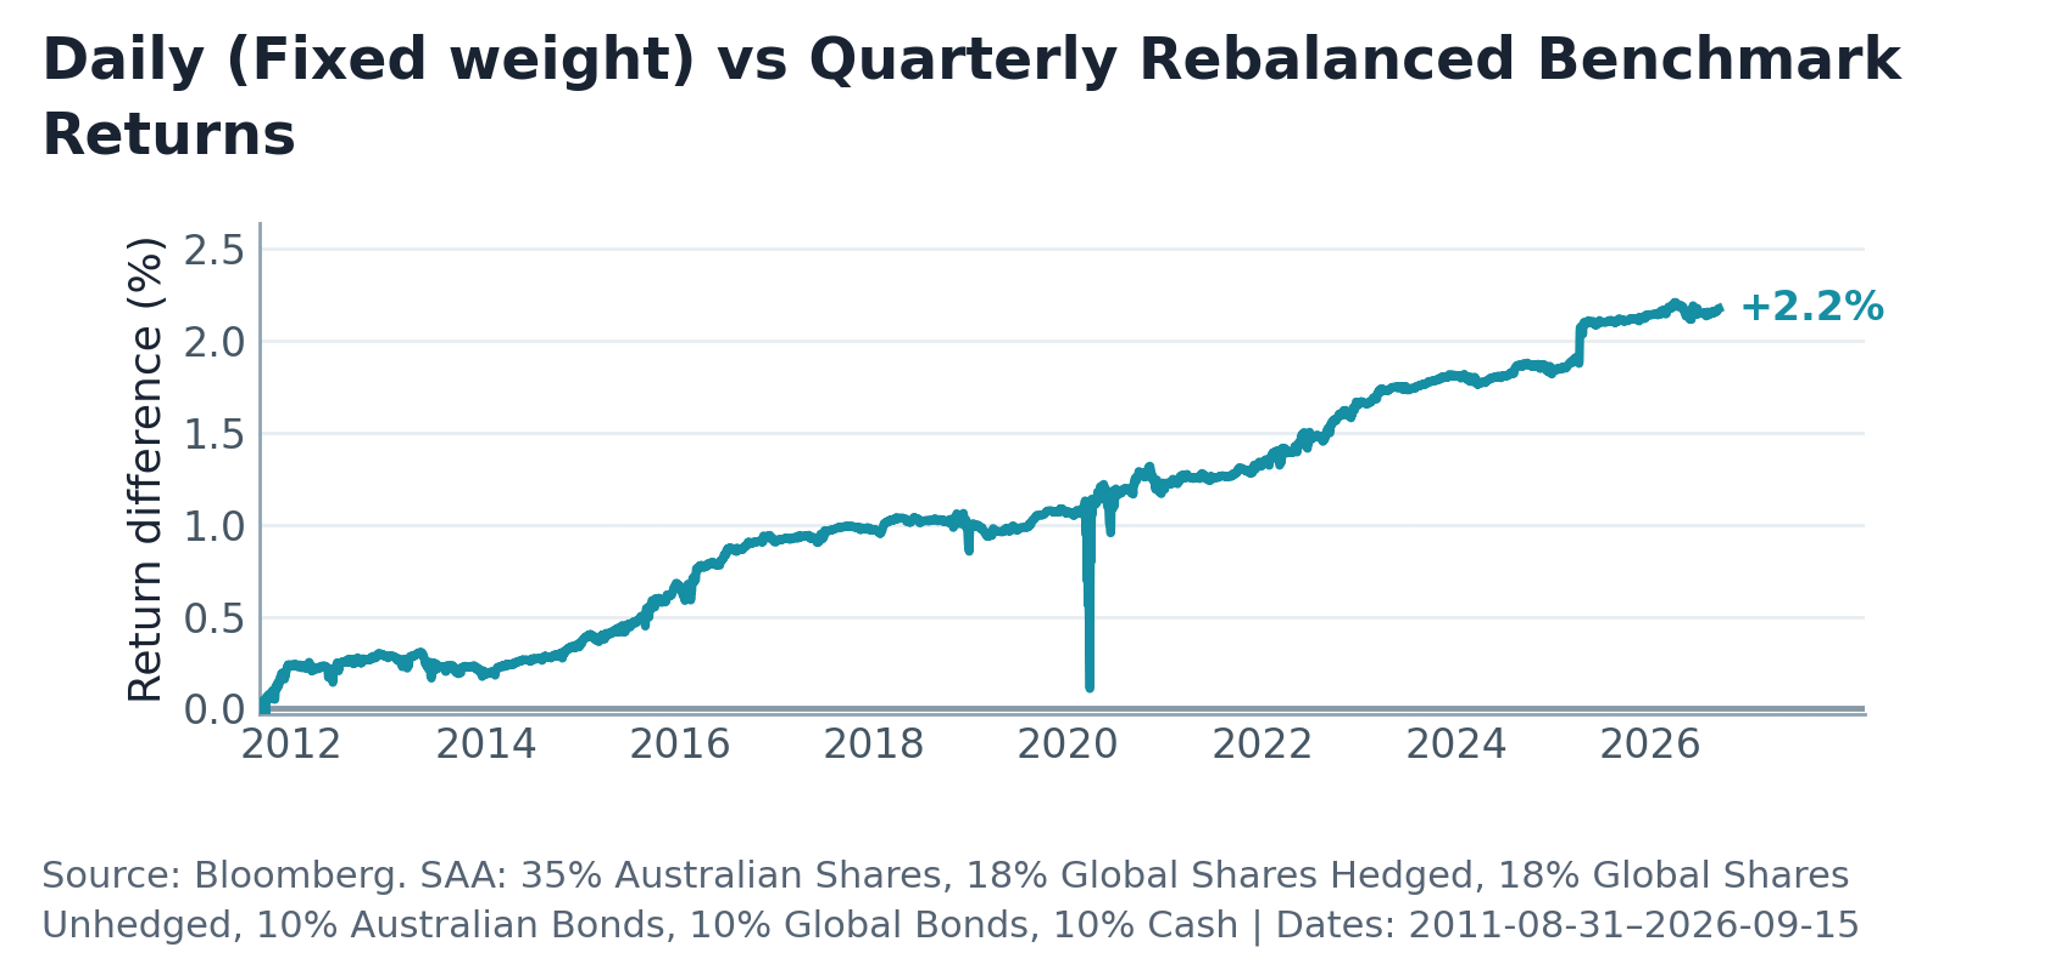
Chart explanation
The chart shows the cumulative return difference between daily and quarterly rebalanced SAA benchmarks. Over time, rebalancing frequency can materially affect benchmark returns, creating apparent (or imaginary) alpha that the investment portfolio is unable to replicate.
Tracking error transaction costs trade-off
Rebalancing would be simple if portfolios could trade every day to keep exposures exactly in line with target weights. In practice, transaction costs and tax make this uneconomical.
Every rebalancing approach therefore involves a trade-off between reducing tracking error and limiting transaction costs and avoid crystalising taxable gains. The appropriate balance between these competing forces depends on the portfolio’s priorities: tighter benchmark alignment requires more trading, while lower transaction costs generally mean accepting greater tracking error. This trade-off is fundamental to all rebalancing and means there is no single optimal rebalancing policy.
LOWER TRACKING ERROR
Requires more frequent trading
LOWER TRANSACTION COSTS & TAX CRYSTALISATION
Generally means accepting greater tracking error
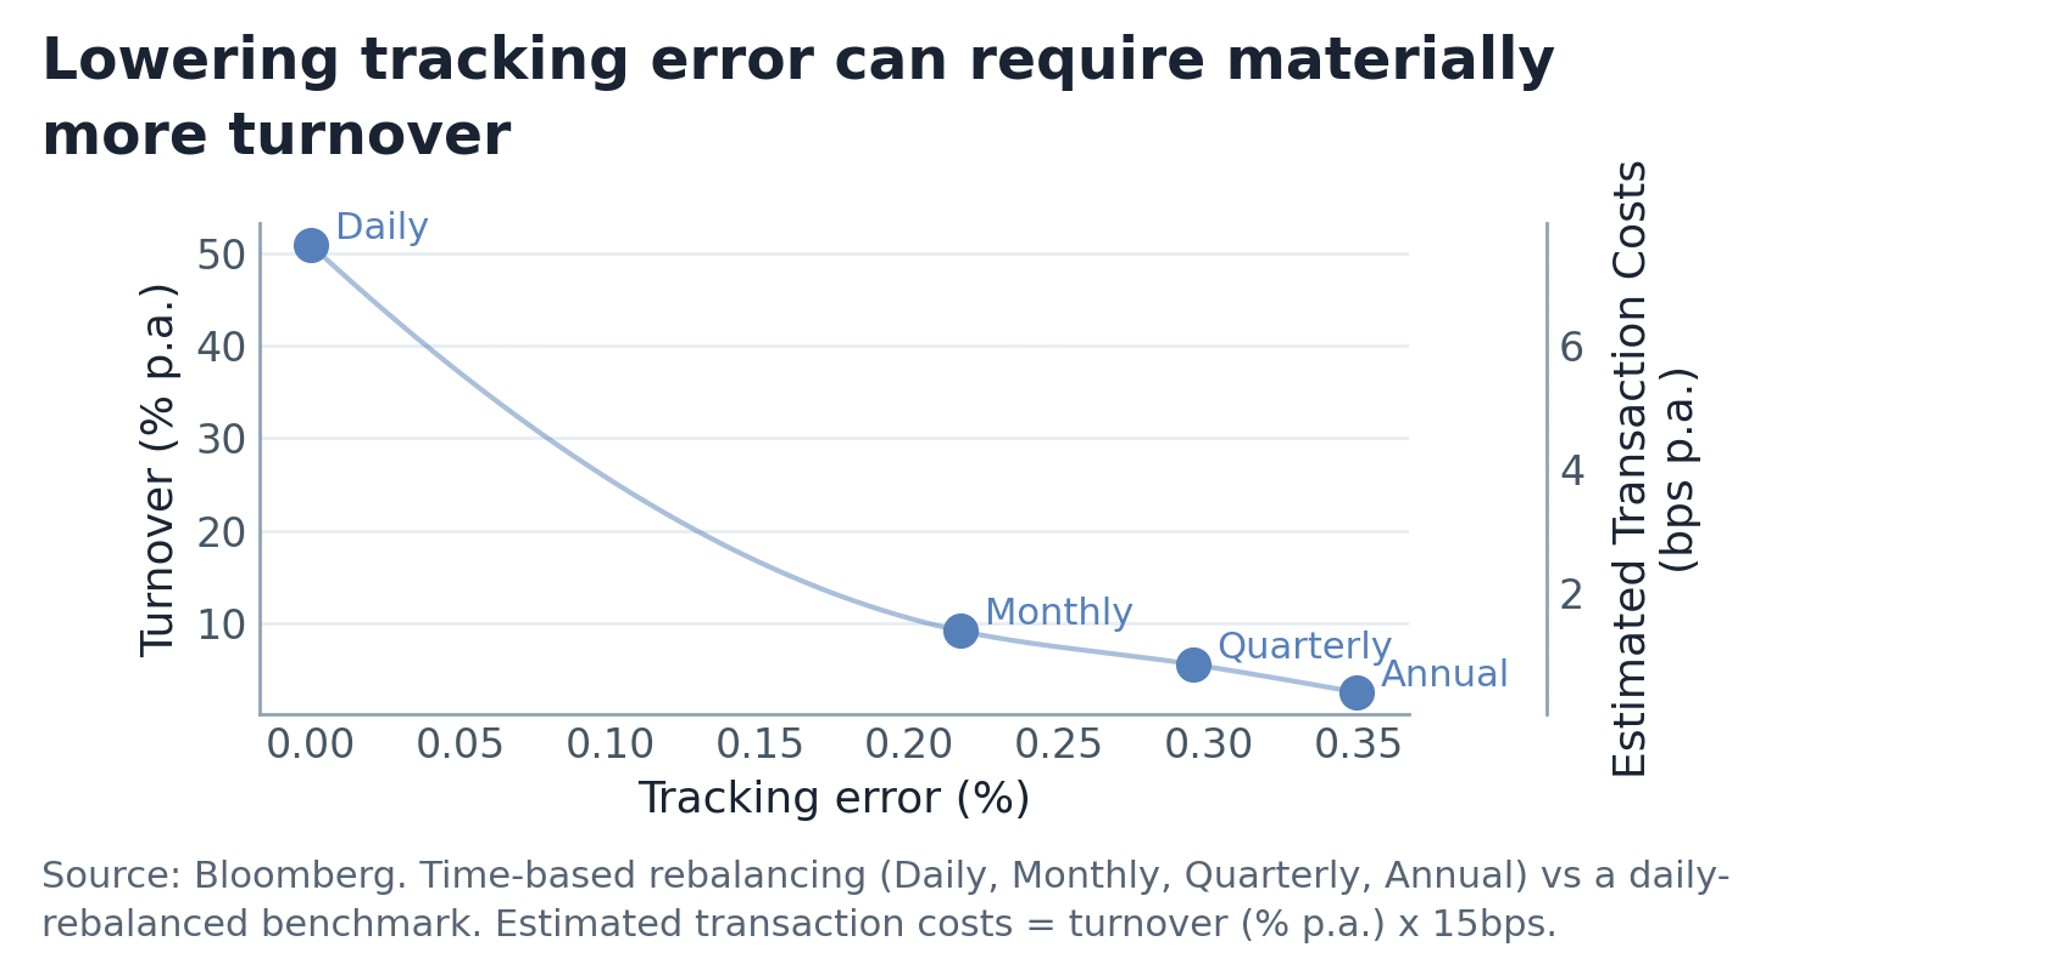
Chart explanation
The chart shows the tracking error/ turnover frontier across different time-based rebalancing approaches. More frequent rebalancing improves benchmark tracking, but at the cost of higher portfolio turnover.
Triggers and actions
Rebalancing has two fundamental components: Triggers - these dictate when you rebalance. Actions - what you do once a trigger is hit.
Main trigger options
- Time-based: Rebalance on a set schedule, such as daily, monthly, quarterly or annually. Monthly and annual rebalancing are common approaches.
- Distance from benchmark: Rebalance when an asset class weight moves beyond a specified tolerance around its benchmark weight-for example, when an exposure deviates by more than ±1% from its SAA weight. Many portfolios using this approach also apply tolerance ranges to broader asset groupings, such as equities, real assets or growth assets.
- Risk-based: Rebalance when portfolio risk moves outside a predefined tolerance, for example 25 bps of ex-ante tracking error.
Main action options
- Full rebalance: Return the portfolio fully to benchmark weights.
- Partial rebalance: Move part of the way back to benchmark, for example closing 50% of the deviation.
- Rebalance to tolerance: Trade only enough to bring the portfolio back within its permitted risk or exposure range.
Whichever action you choose (including a hybrid approach which is common), remember that benchmark weights may drift between benchmark rebalancing dates. So make sure you rebalance to the benchmark weights that apply at the time, and don’t just rely on the original strategic weights.
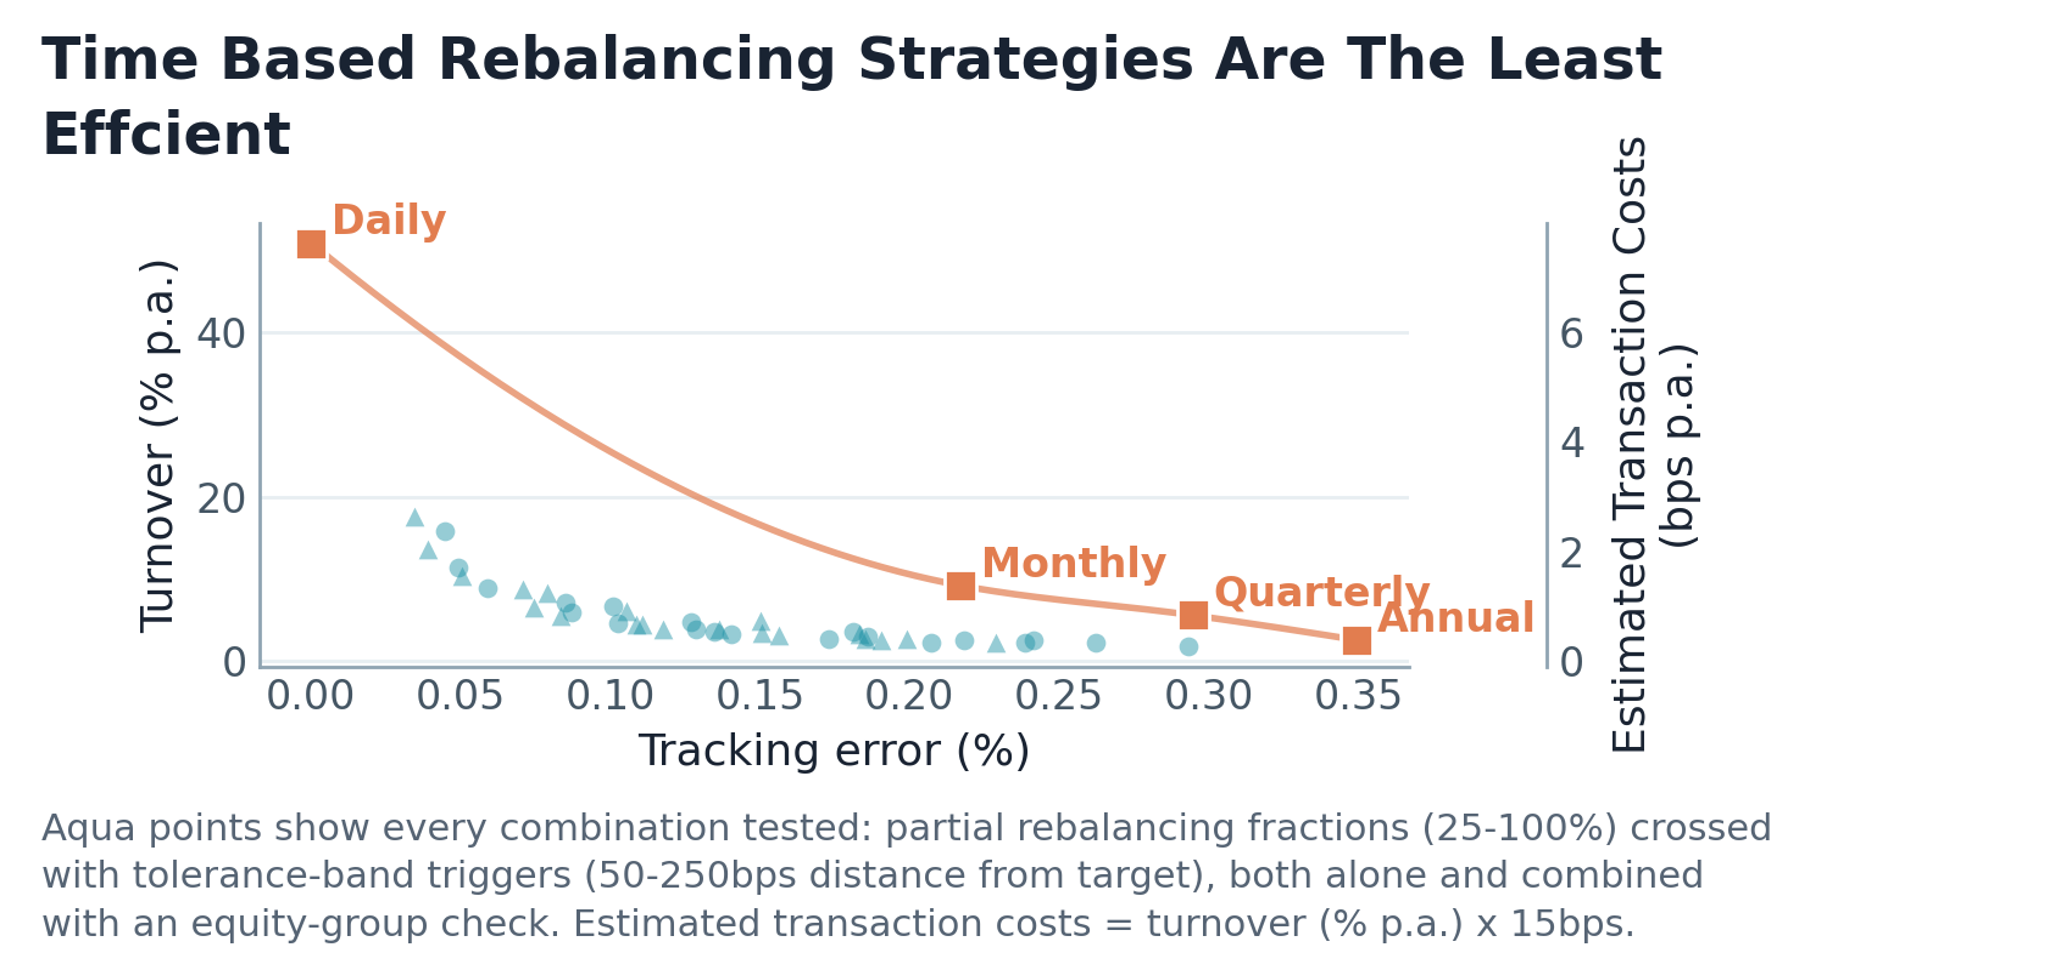
Chart explanation
The chart compares a range of rebalancing approaches, including tolerance band triggers, partial rebalancing and time-based strategies. Two points stand out: all approaches involve a trade-off between tracking error and cost, and time-based rebalancing is materially less efficient than all the other alternatives (which are fairly similar to each other).
Some asset classes can’t be rebalanced
Many portfolios hold unlisted assets that cannot be readily rebalanced. These exposures can therefore drift materially from their strategic asset allocation.
There are three broad ways to manage this drift:
- Accept the drift: Allow the exposure to remain off target until an opportunity arises to buy or sell the underlying asset.
- Proxy the exposure: Use listed or derivative exposures to offset some of the unintended allocation drift.
- Update the strategic allocation: When tracking error is a key concern, adjust the strategic asset allocation to better reflect the actual unlisted asset exposure. Essentially, this approach rebalances the benchmark to the portfolio.
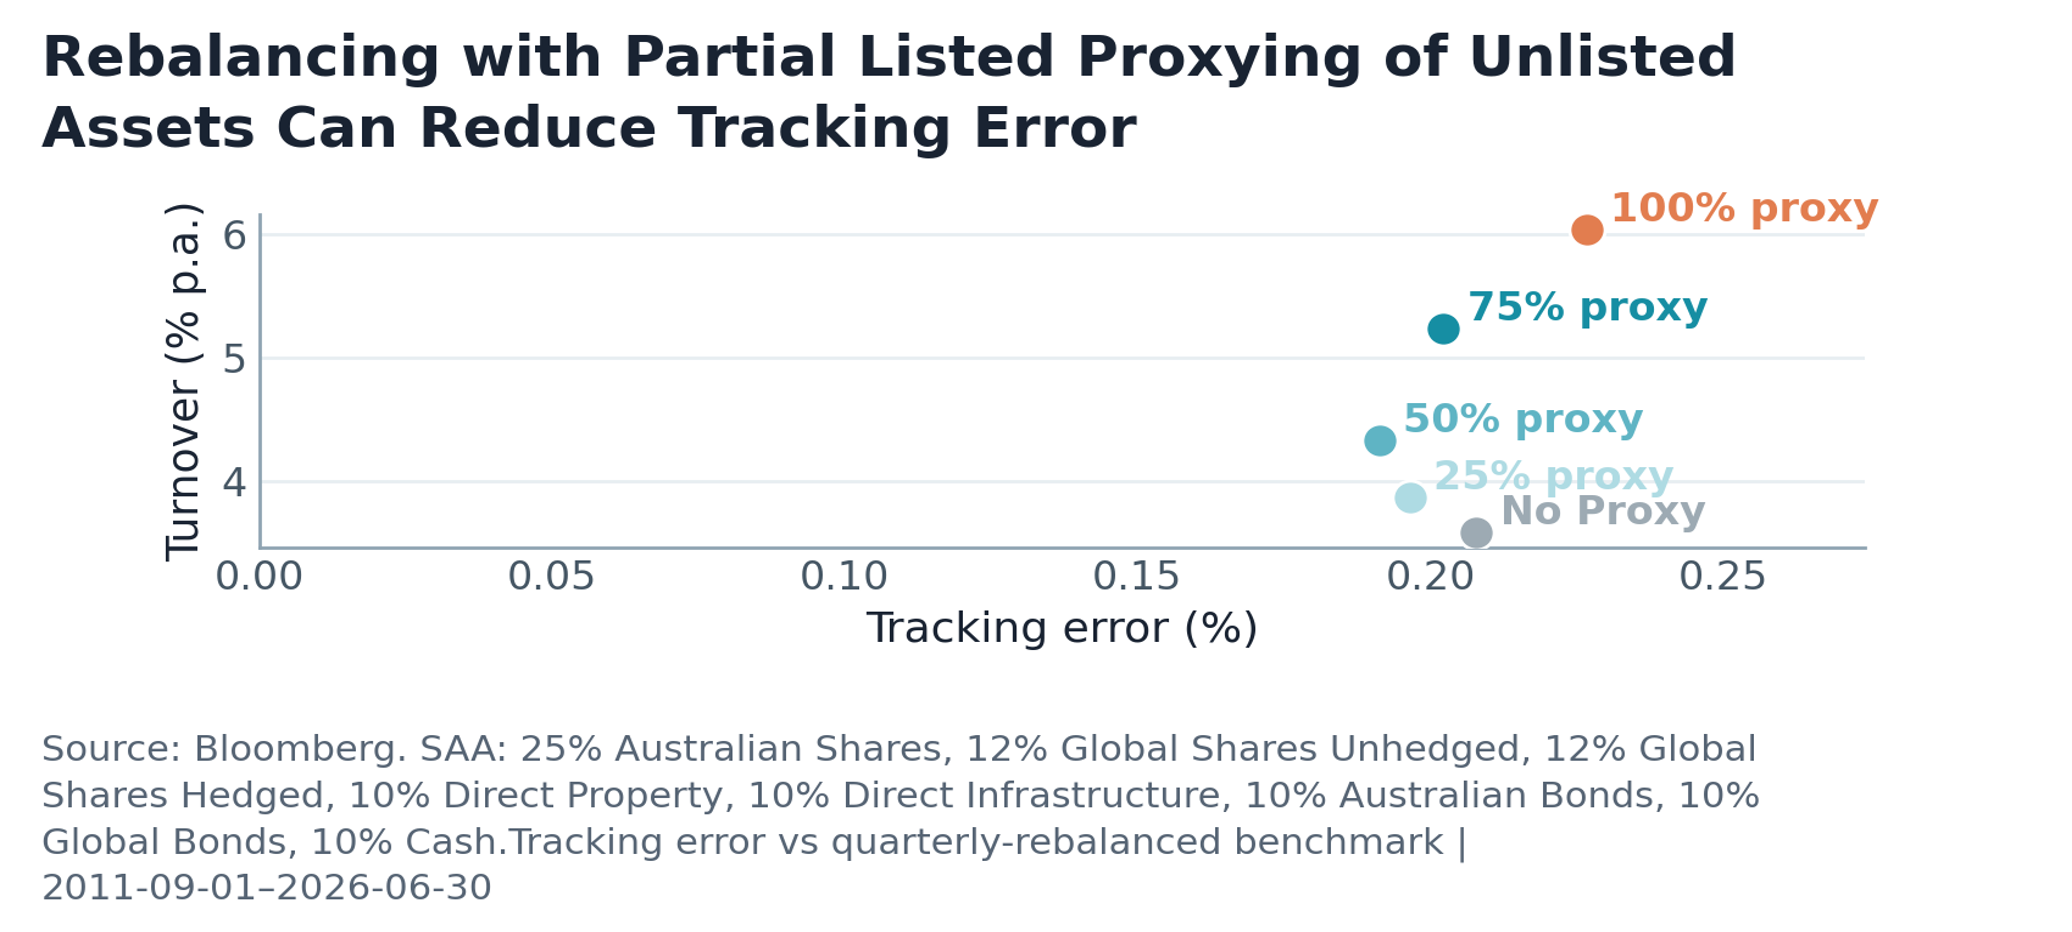
Chart explanation
The chart illustrates how using listed property and infrastructure as partial proxies for unlisted exposures during portfolio rebalancing can reduce tracking error relative to allowing asset-class weights to drift with market movements. However, the results also highlight the importance of calibrating the degree of proxying appropriately. In particular, proxying 100% of the required rebalancing trade results in greater tracking error than undertaking no proxy-based rebalancing at all. To interpret the chart, a 25% proxy means that when unlisted property reaches a rebalancing trigger, 25% of the trade that would have been undertaken if the asset class were fully liquid is instead implemented using listed property.
Beware: proxying is sensitive to the time horizon
Using listed assets as proxies for unlisted exposures is a complex process, with outcomes highly sensitive to both the expected holding period of the proxy position and the time horizon over which risk is measured. As a result, a proxying approach that is effective over one horizon may be less effective, or even increase risk, over another.
Don’t forget currency exposures
After equity market risk, FX risk is often one of the largest sources of risk in a diversified portfolio.
A key FX rebalancing consideration is whether FX exposure and hedging is embedded within the underlying asset building blocks or managed separately as an overlay. This determines whether FX can be rebalanced independently of the underlying assets. If adjusting the currency hedge also requires trading physical assets, the transaction costs and potential tax frictions of both the FX hedges and the underlying assets need to be considered when making rebalancing decisions.
How a portfolio structures its FX exposure becomes particularly important during periods of market stress. Where currency is managed as an overlay, large FX moves-for example, a sharp fall in the AUD-can materially increase the AUD value of unhedged or partially hedged offshore assets, while losses on FX hedging contracts can simultaneously reduce the portfolio’s liquid cash position.
FX rebalancing is easy to overlook but deserves careful consideration because:
- FX contracts roll frequently and often in large volumes.
- FX can be a major source of risk and tracking error, particularly during volatile markets.
- Asset class indices and diversified SAA benchmarks may rebalance on different schedules, creating additional complexity.
- Structural decisions can have significant consequences and may be difficult to change once a portfolio is established.
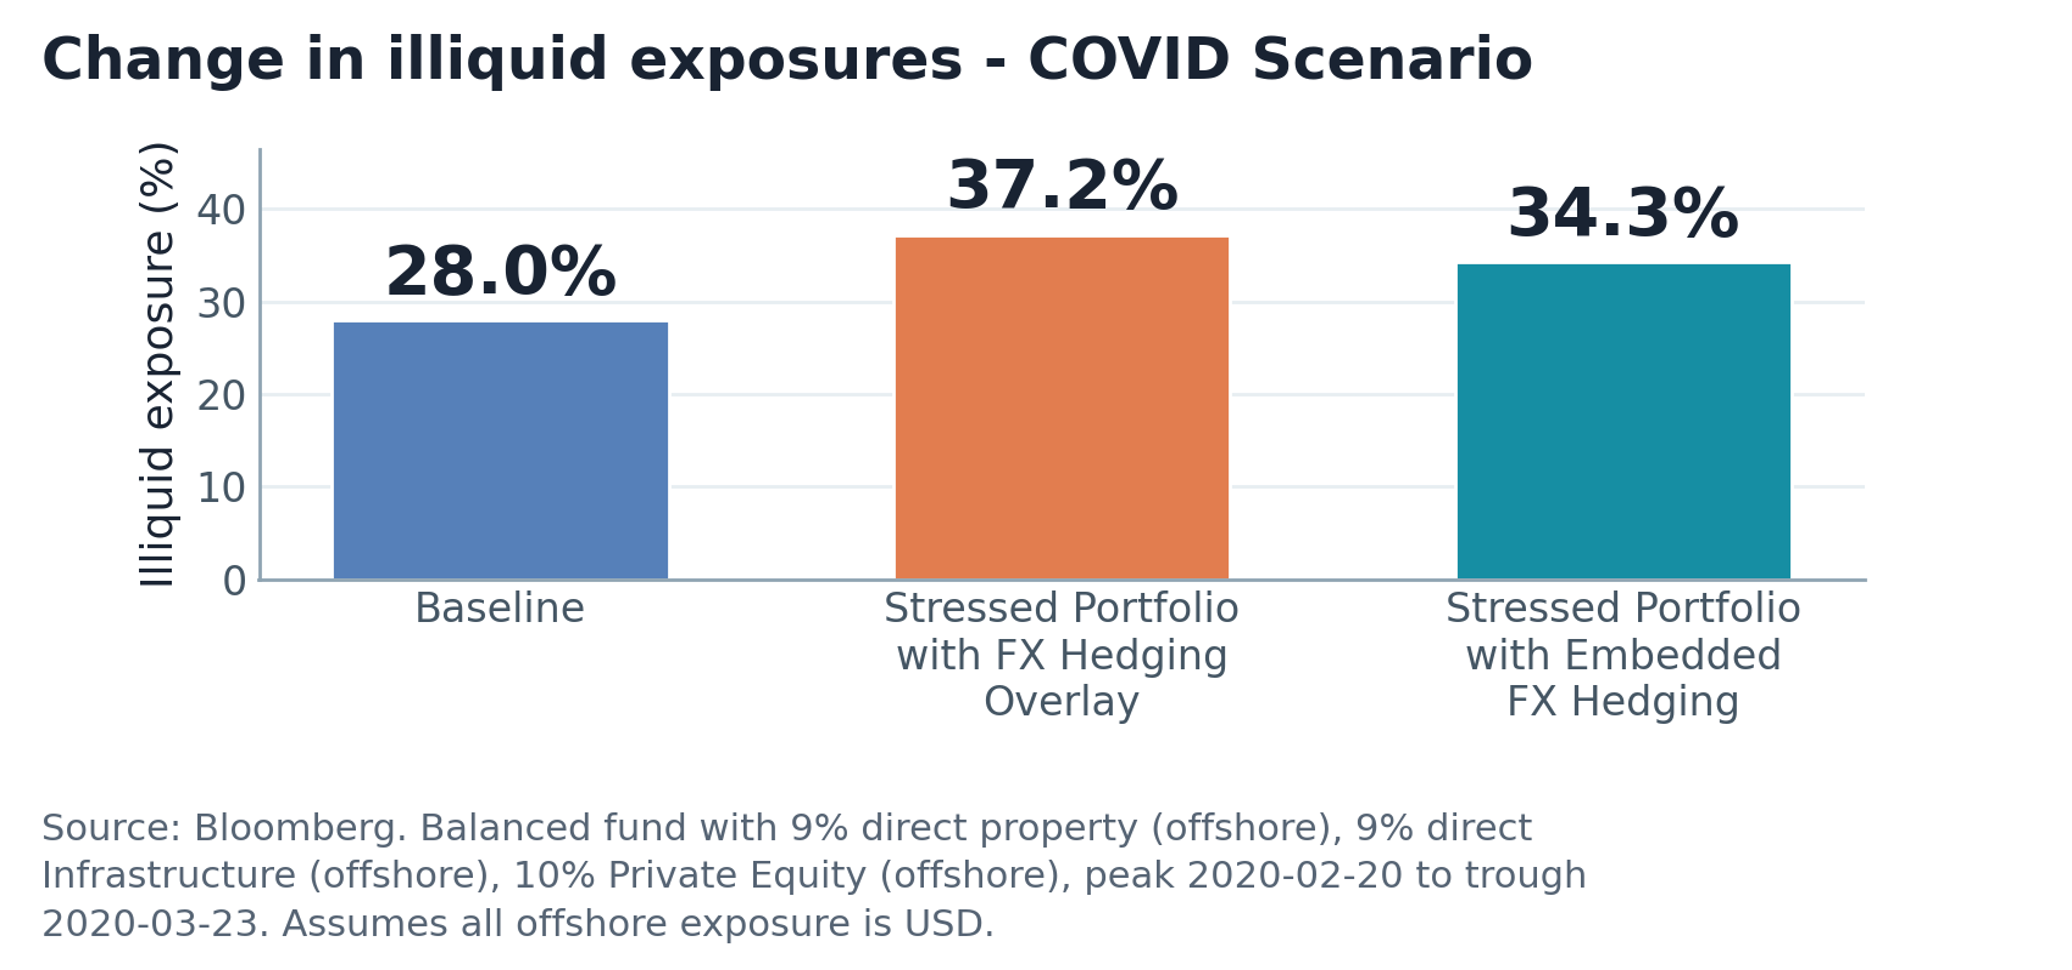
Chart explanation
The chart uses the historic COVID-19 scenario to show how a portfolio’s illiquid exposure can differ materially during market stress depending on whether FX hedging is managed as an overlay or embedded within the underlying unlisted asset building blocks/mandates. This dynamic is an important consideration when structuring a portfolio’s FX hedging programme.
What does good rebalancing look like?
There is no universally optimal rebalancing approach. As mentioned, much of the decision comes down to a portfolio specific trade-off between transaction and tax costs on one hand, and tracking error on the other.
However, good rebalancing frameworks tend to share several common features:
- Clear objectives and ongoing review: The approach should be deliberate, have clearly defined objectives and be reviewed regularly. Its impact on both performance and risk should be regularly monitored.
- Efficient implementation: Rebalancing should minimise unnecessary turnover. Where appropriate, instruments such as futures can be used instead of trading physical securities, particularly where the required adjustment is expected to be temporary.
- Efficient portfolio structure: Good portfolio design can make rebalancing materially easier and cheaper. Examples include structurally separating FX hedging from underlying listed asset exposures and, where multiple portfolios are managed, using common building blocks that allow exposures to be transferred or crossed between funds.
- Room for judgement: Markets and portfolios are messy and too complex to be managed through rigid rebalancing rules alone. A strong rebalancing framework should provide clear decision-making guidance while still allowing for qualitative considerations such as upcoming cash flows, major market events and known changes to the portfolio.
My preferred approach
- Risk based triggers, such as 25 bps of ex-ante tracking error.
- Partial rather than full rebalancing to the SAA benchmark.
- A strong preference for using futures where the required adjustment is likely to be temporary.
- Qualitative/Portfolio Manager review of all rebalancing trades.
- Vigilant monitoring, but patience when it comes to trading. Turnover always incurs frictions which result in a performance drag relative to the SAA benchmark.
- Where possible, a consistent building block structure across the entire suite of portfolios being managed.
For those looking for something simpler, relatively straightforward rules can still work well. For example, partially rebalancing when an asset class deviates by 1% from its target weight can provide a simple and effective policy framework.
Important information
® North and MyNorth are trademarks registered to NMMT.
The information on this page has been provided by NMMT Limited ABN 42 058 835 573, AFSL 234653 (NMMT). It contains general advice only, does not take account of your client’s personal objectives, financial situation or needs, and a client should consider whether this information is appropriate for them before making any decisions. It’s important your client consider their circumstances and read the relevant product disclosure statement (PDS), investor directed portfolio guide (IDPS Guide) and target market determination (TMD), available from northonline.com.au or by contacting the North Service Centre on 1800 667 841, before deciding what’s right for them.
MyNorth Investment and North Investment are operated by NMMT. MyNorth Investment Guarantee is issued by National Mutual Funds Management Limited ABN 32 006 787 720, AFSL 234652 (NMFM). MyNorth Super and Pension (including MyNorth Lifetime), MyNorth Super and Pension Guarantee and North Super and Pension are issued by N.M. Superannuation Proprietary Limited (ABN 31 008 428 322, AFSL 234654 (NM Super) as trustee of the Wealth Personal Superannuation and Pension Fund (the Fund) ABN 92 381 911 598. NMMT issues the interests in and is the responsible entity for MyNorth Managed Portfolios. All managed portfolios may not be available across all products on the North platform. All of the products above are referred to collectively as MyNorth Products. The information on this page is provided only for the use of advisers, it is not intended for clients. This page provides a brief overview of some of the benefits of investing in MyNorth Products. The adviser remains responsible for any advice/services they provide to clients including making their own inquiries and ensuring that the advice/services are appropriate and in accordance with all legal requirements.
You can read the Financial Services Guide online for more information, including the fees and benefits that companies related to NMMT, N.M. Superannuation Proprietary Limited ABN 31 008 428 322, AFSL 234654 (N.M. Super) and their representatives may receive in relation to products and services provided.
North and MyNorth are trademarks registered to NMMT.
All information on this website is subject to change without notice.
This article is for professional adviser use only and mustn’t be distributed to or made available to retail clients. It contains general advice only and doesn’t consider a person’s personal goals, financial situation or needs. A person should consider whether this information is appropriate for them before making any decisions. It’s important a person considers their circumstances and reads the relevant product disclosure statement and/or investor directed portfolio services guide, available from NMMT at northonline.com.au or by calling 1800 667 841, before deciding what’s right for them. You can read the NMMT Financial Services Guide online for more information, including the fees and benefits that AMP companies and their representatives may receive in relation to products and services provided. You can also ask us for a hard copy.
Past performance is not a reliable indicator of future performance.
This article includes forecasts, statements and estimates in relation to future matters, many of which are based on subjective judgements and/or proprietary internal modelling. No representation is made that such statements or estimates will prove correct. The reader should be aware that forward-looking statements are predictive in character and may be affected by inaccurate assumptions and/or by known or unknown risks and uncertainties. Results ultimately achieved may differ materially from forecast results. No independent third party has reviewed the reasonableness of any such forward-looking statements or the assumptions on which those forecasts are based.
The performance results in this article are hypothetical back test results for a model portfolio. They do not reflect the performance of actual investments. The back-tested results were achieved by means of the retroactive application of a model that was designed with the benefit of hindsight. This cannot reflect all of the complexities of actual investing and there are many material factors that would have affected actual results, including those relating to the markets in general, the impact of fees and expenses, liquidity activity and other factors, any or all of which may have adversely affected actual performance.
A number of the statements are based on information and research published by others. We have not confirmed, and do not warrant, the accuracy or completeness of that third-party information or research.
All third-party brands, indices and trademarks mentioned are property of their respective owners. Their mention in this article is for illustrative purposes: it does not constitute an endorsement of any product, service or strategy.